The D3 library topojson can be used to render topographical maps.
Here is an example of a world map. Countries are assigned a shade of blue based on their population. Hovering over a country displays a tooltip that shows the country name and its population. Buttons at the bottom support panning and zooming. The button in the center of the arrow buttons resets the pan and zoom. Dragging the map moves it. Double-clicking the map zooms in, or zooms out if the shift key is down.
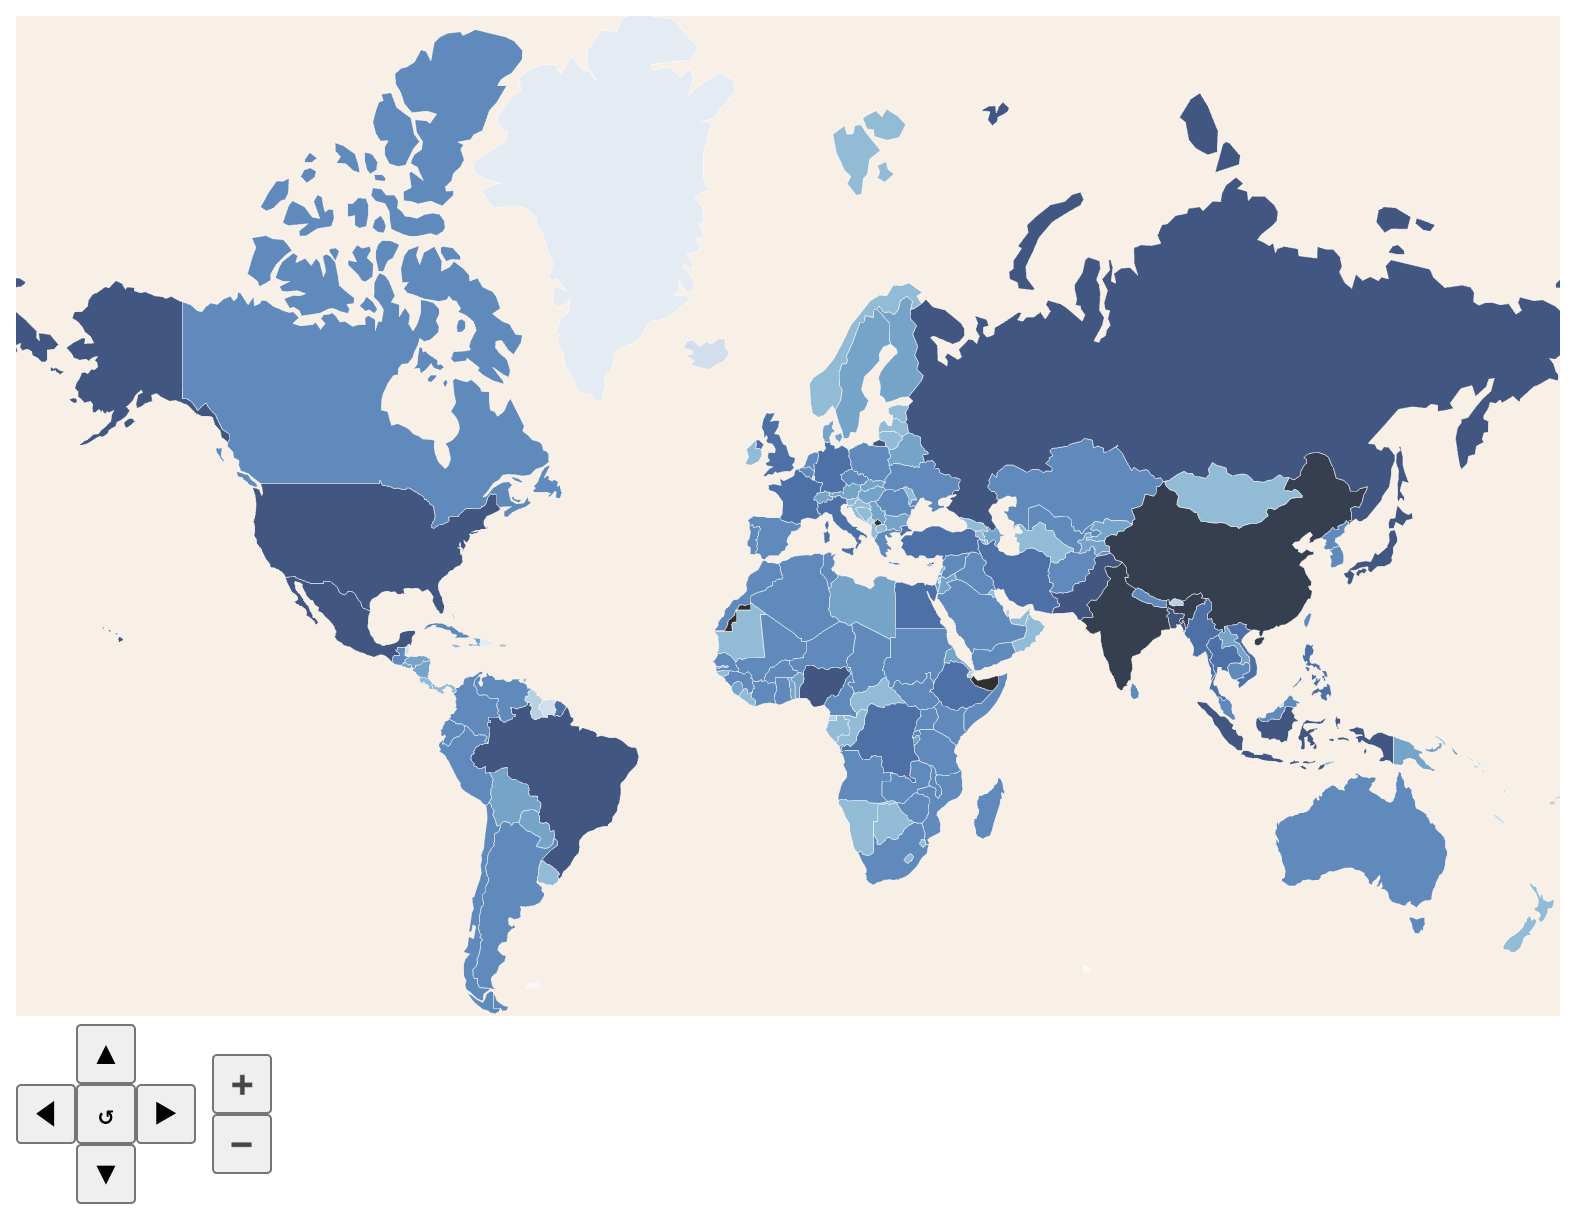
To see this in action, browse Country Populations.
This uses two input files, world-countries.json and world-population.tsv.
These files can be obtained from a
gist by Jeremy Lin.
index.html
<!DOCTYPE html>
<html>
  <head>
    <meta charset="utf-8" />
    <link rel="stylesheet" href="pan-zoom.css" />
    <link rel="stylesheet" href="world-map.css" />
    <script src="https://d3js.org/d3.v5.min.js"></script>
    <script src="https://d3js.org/topojson.v2.min.js"></script>
    <script defer type="module">
      import {createWorldMap} from './world-map.js';
      createWorldMap('world-map');
    </script>
  </head>
  <body>
    <svg id="world-map" />
    <div class="tooltip">
      <div>
        <label>Country:</label>
        <span class="country"></span>
      </div>
      <div>
        <label>Population:</label>
        <span class="population"></span>
      </div>
    </div>
  </body>
</html>
world-map.js
import {panZoomSetup} from './pan-zoom.js';

// These values were carefully selected to make the map fill the SVG.
const MAP_SCALE = 123;
const SVG_WIDTH = 772;
const SVG_HEIGHT = 500;

// Create a function that a population number
// to a shade of blue for country fills.
const color = d3
  .scaleThreshold()
  .domain([
    10000,
    100000,
    500000,
    1000000,
    5000000,
    10000000,
    50000000,
    100000000,
    500000000,
    1500000000
  ])
  .range([
    'rgb(247,251,255)',
    'rgb(222,235,247)',
    'rgb(198,219,239)',
    'rgb(158,202,225)',
    'rgb(107,174,214)',
    'rgb(66,146,198)',
    'rgb(33,113,181)',
    'rgb(8,81,156)',
    'rgb(8,48,107)',
    'rgb(3,19,43)'
  ]);

// Create a function to format numbers with commas.
const format = d3.format(',');

const tooltip = d3.select('.tooltip');
const tooltipCountry = tooltip.select('.country');
const tooltipPopulation = tooltip.select('.population');

function hideTooltip() {
  tooltip.style('opacity', 0);
}

async function load(svg, path) {
  // Load the id, name, and polygon coordinates of each country.
  let res = await fetch('world-countries.json');
  const data = (await res.json()).features;

  // Load the id and population of each country.
  res = await fetch('world-population.tsv');
  const tsv = await res.text();
  const lines = tsv.split('\n');
  const population = lines.map(line => {
    const [id, , population] = line.split('\t');
    return {id, population};
  });

  // Add the population of each country to its data object.
  const populationById = {};
  for (const d of population) {
    populationById[d.id] = Number(d.population);
  }
  for (const d of data) {
    d.population = populationById[d.id];
  }

  // Create an SVG group containing a path for each country.
  svg
    .append('g')
    .attr('class', 'countries')
    .selectAll('path')
    .data(data)
    .enter()
    .append('path')
    .attr('d', path) // path is a function that is passed a data object
    .style('fill', d => color(d.population))
    .on('mouseenter', pathEntered)
    .on('mousemove', pathMoved)
    .on('mouseout', hideTooltip);
}

// This handles when the mouse cursor
// enters an SVG path that represent a country.
function pathEntered() {
  // Move this path element to the end of its SVG group so it
  // renders on top which allows it's entire stroke is visible.
  this.parentNode.appendChild(this);
}

// This handles when the mouse cursor
// moves over an SVG path that represent a country.
function pathMoved(d) {
  // Configure the tooltip.
  tooltipCountry.text(d.properties.name);
  tooltipPopulation.text(format(d.population));
  tooltip
    .style('left', d3.event.pageX + 'px')
    .style('top', d3.event.pageY + 'px');

  // Show the tooltip.
  tooltip.style('opacity', 0.7);
}

export function createWorldMap(svgId) {
  const svg = d3
    .select('#' + svgId)
    .attr('width', SVG_WIDTH)
    .attr('height', SVG_HEIGHT)
    .attr('viewBox', `0 0 ${SVG_WIDTH} ${SVG_HEIGHT}`);

  panZoomSetup(svgId, SVG_WIDTH, SVG_HEIGHT);

  // Create a function that manages displaying geographical data.
  const projection = d3
    .geoMercator()
    .scale(MAP_SCALE)
    .translate([SVG_WIDTH / 2, SVG_HEIGHT / 1.41]);

  // Create a function generate a value for the "d" attribute
  // of an SVG "path" element given polygon data.
  const path = d3.geoPath().projection(projection);

  load(svg, path);
}
world-map.css
body {
  font-family: sans-serif;
}

.countries > path {
  opacity: 0.8;
  stroke: white;
  stroke-width: 0.3;
}

.countries > path:hover {
  opacity: 1;
  stroke: red;
  stroke-width: 1;
  z-index: 1;
}

svg {
  background-color: linen;
  cursor: move;
}

.tooltip {
  position: absolute;
  background: darkgreen;
  border-radius: 5px;
  color: white;
  opacity: 0; /* initially hidden */
  padding: 0.5rem;
  pointer-events: none;
}
pan-zoom.js
This supports panning and zooming on any SVG.
It does this by modifying its viewBox attribute.
// Each pan using the arrow keys pans the SVG by this percentage.
const PAN_PERCENT = 0.05;

// Each zoom in/out does so by this percentage.
const ZOOM_PERCENT = 0.15;

// This maps key names to functions that
// should be invoked when they are pressed.
const keyToFnMap = {
  '+': zoomIn,
  '-': zoomOut,
  ArrowLeft: panLeft,
  ArrowRight: panRight,
  ArrowUp: panUp,
  ArrowDown: panDown
};

function addControlButtons(svg, svgWidth, svgHeight) {
  function addButton(parent, html, onClick) {
    parent
      .append('button')
      .html(html)
      .on('click', () => onClick(svg));
  }

  // This resets the SVG viewBox to its original values
  // which undoes all panning and zooming.
  function reset(svg) {
    svg.attr('viewBox', `0 0 ${svgWidth} ${svgHeight}`);
  }

  const container = getParentSelection(svg);
  const controls = container.append('div').attr('class', 'controls');
  const panDiv = controls.append('div').attr('class', 'pan');

  let div = panDiv.append('div');
  addButton(div, '▲', panUp);

  div = panDiv.append('div');
  addButton(div, '◀', panLeft);
  addButton(div, '↺', reset);
  addButton(div, '▶', panRight);

  div = panDiv.append('div');
  addButton(div, '▼', panDown);

  div = controls.append('div').attr('class', 'zoom');
  addButton(div, '➕', zoomIn);
  addButton(div, '➖', zoomOut);
}

function getParentSelection(selection) {
  return selection.select(function () {
    return this.parentNode;
  });
}

function panDown(svg) {
  const [x, y, width, height] = svg.attr('viewBox').split(' ');
  const dy = Number(height) * PAN_PERCENT;
  svg.attr('viewBox', `${x} ${Number(y) + dy} ${width} ${height}`);
}

function panLeft(svg) {
  const [x, y, width, height] = svg.attr('viewBox').split(' ');
  const dx = Number(width) * PAN_PERCENT;
  svg.attr('viewBox', `${Number(x) - dx} ${y} ${width} ${height}`);
}

function panRight(svg) {
  const [x, y, width, height] = svg.attr('viewBox').split(' ');
  const dx = Number(width) * PAN_PERCENT;
  svg.attr('viewBox', `${Number(x) + dx} ${y} ${width} ${height}`);
}

function panUp(svg) {
  const [x, y, width, height] = svg.attr('viewBox').split(' ');
  const dy = Number(height) * PAN_PERCENT;
  svg.attr('viewBox', `${x} ${Number(y) - dy} ${width} ${height}`);
}

// This zooms in or out depending on whether the shift key is down.
function zoom(svg) {
  const fn = d3.event.shiftKey ? zoomOut : zoomIn;
  fn(svg);
}

// This zooms in on the SVG, maintaining the current center.
function zoomIn(svg) {
  const [x, y, width, height] = svg.attr('viewBox').split(' ');
  const factor = 1 - ZOOM_PERCENT;
  const newWidth = Number(width) * factor;
  const dx = (newWidth - width) / 2;
  const newHeight = Number(height) * factor;
  const dy = (newHeight - height) / 2;
  svg.attr('viewBox', `${x - dx} ${y - dy} ${newWidth} ${newHeight}`);
}

// This zooms out on the SVG, maintaining the current center.
function zoomOut(svg) {
  const [x, y, width, height] = svg.attr('viewBox').split(' ');
  const factor = 1 + ZOOM_PERCENT;
  const newWidth = Number(width) * factor;
  const dx = (newWidth - width) / 2;
  const newHeight = Number(height) * factor;
  const dy = (newHeight - height) / 2;
  svg.attr('viewBox', `${x - dx} ${y - dy} ${newWidth} ${newHeight}`);
}

export function panZoomSetup(svgId, svgWidth, svgHeight) {
  const svg = d3.select('#' + svgId);

  let lastX, lastY;

  // This handles dragging on the SVG to change the visible portion.
  function dragged() {
    const [boxX, boxY, width, height] = svg.attr('viewBox').split(' ');
    const {x, y} = d3.event;
    const scaleX = width / svgWidth;
    const scaleY = height / svgHeight;
    const dx = (lastX - x) * scaleX;
    const dy = (lastY - y) * scaleY;
    lastX = x;
    lastY = y;
    svg.attr(
      'viewBox',
      `${Number(boxX) + dx} ${Number(boxY) + dy} ${width} ${height}`
    );
  }

  function dragStarted() {
    lastX = d3.event.x;
    lastY = d3.event.y;
  }

  // Create a function that will manage mouse drags on the SVG.
  const drag = d3.drag().on('start', dragStarted).on('drag', dragged);

  svg.call(drag);

  svg.on('dblclick', () => zoom(svg));

  // Set up event handling for all the keyboard shortcuts in keyToFnMap.
  d3.select('body').on('keydown', () => {
    const fn = keyToFnMap[d3.event.key];
    if (fn) fn(svg);
  });

  addControlButtons(svg, svgWidth, svgHeight);
}
pan-zoom.css
.controls {
  display: flex;
  align-items: center;
}

.controls button {
  --size: 30px;
  height: var(--size);
  width: var(--size);
  text-align: center;
}

.pan {
  display: inline-block;
}

.pan > div {
  display: flex;
  justify-content: center;
}

#reset {
  display: flex;
  justify-content: center;
  align-items: center;

  font-size: 1.5rem;
}

.zoom {
  display: inline-flex;
  flex-direction: column;
  margin-left: 0.5rem;
}