Pie Charts
index.html for pie chart
<html>
  <head>
    <title>D3 SVG Pie Chart</title>
    <script src="https://d3js.org/d3.v5.min.js"></script>
    <style>
      body {
        display: flex;
        align-items: flex-start;

        font-family: sans-serif;
      }

      .key {
        display: inline-block;

        background-color: linen;
        margin-left: 1rem;
        width: 100px;
      }

      .player {
        display: flex;
        justify-content: space-between;

        color: white;
        padding: 0.5rem;
      }

      .tooltip {
        position: absolute;
        background: lightgray;
        border: solid gray 1px;
        border-radius: 5px;
        opacity: 0; /* initially hidden */
        padding: 0.5rem;
        pointer-events: none;
      }
    </style>
  </head>
  <body>
    <script src="pie-chart.js"></script>
  </body>
</html>
pie-chart.js
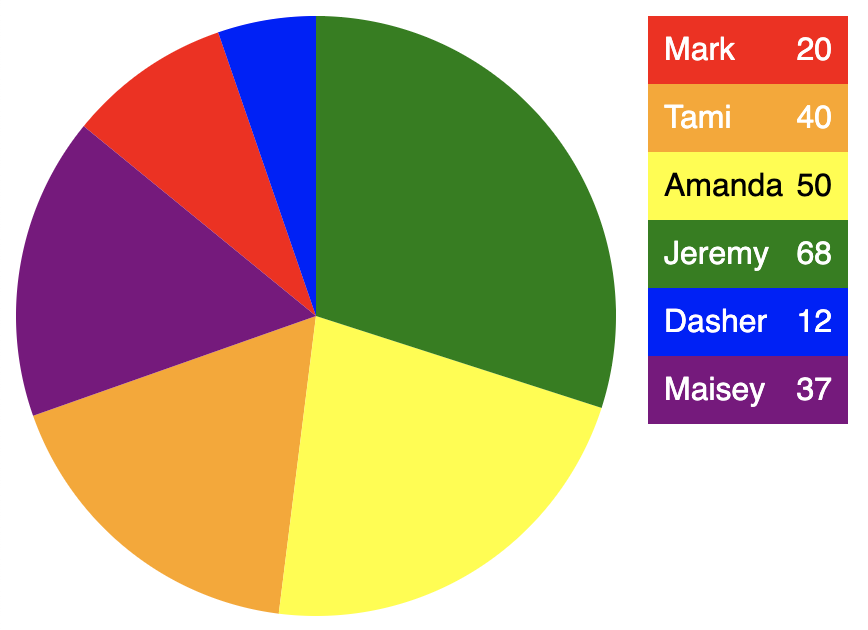
const players = [
  {name: 'Mark', score: 20},
  {name: 'Tami', score: 40},
  {name: 'Amanda', score: 50},
  {name: 'Jeremy', score: 68},
  {name: 'Dasher', score: 12},
  {name: 'Maisey', score: 37}
];

const totalScore = players.reduce((acc, player) => acc + player.score, 0);
console.log('pie-chart.js x: totalScore =', totalScore);

const size = 300;
const radius = size / 2;

const tooltip = d3.select('body').append('div').classed('tooltip', true);

const svg = d3
  .select('body')
  .append('svg')
  .attr('width', size)
  .attr('height', size);
const g = svg.append('g').attr('transform', `translate(${radius}, ${radius})`);

const color = d3.scaleOrdinal([
  'red',
  'orange',
  'yellow',
  'green',
  'blue',
  'purple'
]);

const fontColor = d3.scaleOrdinal([
  'white',
  'white',
  'black',
  'white',
  'white',
  'white'
]);

const pie = d3.pie().value(player => player.score);

const arc = d3.arc().innerRadius(0).outerRadius(radius);

const arcs = g
  .selectAll('arc')
  .data(pie(players))
  .enter()
  .append('g')
  .attr('class', 'arc');
arcs
  .append('path')
  .attr('fill', (_, i) => color(i))
  .attr('d', arc)
  .on('mousemove', function (data) {
    const player = data.data;
    console.log('pie-chart.js x: player =', player);
    // Configure the tooltip.
    tooltip
      .html(player.name + '<br>' + player.score)
      .style('left', d3.event.pageX + 'px')
      .style('top', d3.event.pageY + 'px');
    // Show the tooltip.
    tooltip.style('opacity', 1);
    // Fade the bar.
    d3.select(this).style('opacity', 0.5);
  })
  // Cannot use an arrow function because we need the value of "this".
  .on('mouseout', function () {
    // Hide the tooltip.
    tooltip.style('opacity', 0);
    // Restore the bar opacity.
    d3.select(this).style('opacity', 1);
    d3.select(this).style('outline', 'none');
  });

const playerDivs = d3
  .select('body')
  .append('div')
  .classed('key', true)
  .selectAll('div')
  .data(players)
  .enter()
  .append('div')
  .classed('player', true)
  .style('background-color', (_, i) => color(i))
  .style('color', (_, i) => fontColor(i));

playerDivs
  .append('div')
  .classed('name', true)
  .text(player => player.name);
playerDivs
  .append('div')
  .classed('score', true)
  .text(player => player.score);
Loading Data
Discuss the csv and json methods.